
The challenge
Campaigns, webinars and partner activations were running across regions, but inconsistent naming and CRM practices obscured their connection to opportunities. Leadership could see activity without a reliable view of contribution.
The approach
Interviews with marketing, sales, finance and regional leaders established where information was lost and how teams actually worked. A unified taxonomy and shared lead-source definitions made campaign records comparable.
Attribution rules were connected to opportunity stages and customer touchpoints. Executive dashboards emphasized pipeline influence, conversion and return measures rather than disconnected activity totals.
Regional training and governance supported adoption, giving teams a repeatable method for maintaining the data after implementation.
- 01Standardize campaigns
- 02Connect touchpoints
- 03Attribute opportunities
- 04Guide investment
The outcome
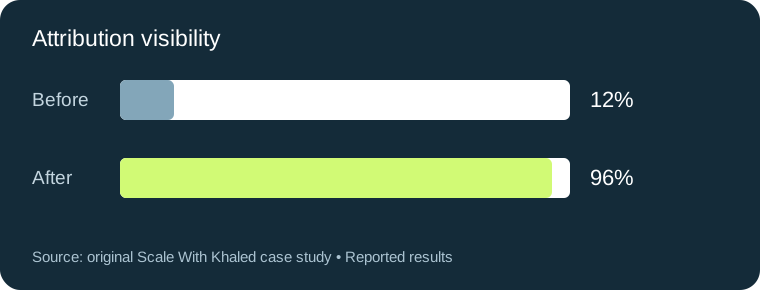
The source reports attribution visibility rising from 12% to 96%, an 80% reduction in reporting time and executive adoption across 14 markets. Better attribution visibility indicates more observable campaign contribution; it does not, by itself, establish incremental revenue.

12 weeks
Salesforce, Microsoft Power BI, Microsoft Excel, LinkedIn Campaign Manager
Source & measurement notes
Rewritten from the original Scale With Khaled project ↗. Figures are reported in that portfolio and have not been independently audited. Comparison periods and measurement limits are preserved where provided.
Banner: AI-generated conceptual artwork. Any original portfolio imagery shown below remains attributed to its source.