
Attribution assigns credit. A credible ROI discussion also asks what changed because of the activity and what it cost to create that change.
A marketing dashboard can be precise without answering the commercial question. It may show clicks, leads and attributed revenue to several decimal places while leaving uncertainty about whether the activity changed customer behavior, whether opportunities were counted twice or whether the cost base was complete.
That problem becomes more visible when one team supports both consumer campaigns and industrial projects. The purchase cycles and data sources differ, but the need for clear definitions is shared.
Separate confidence from measurement quality
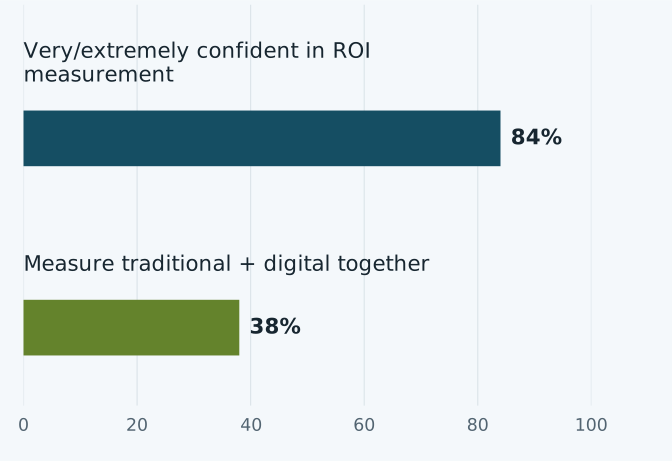
Nielsen’s 2024 global survey found 84% of marketers very or extremely confident in ROI measurement, while 38% measured traditional and digital activity together. [1] These are different survey questions, not opposite categories. They highlight why confidence in a reporting tool should not be confused with a complete view of the customer journey.
Confidence and practice are different measures
Global marketers surveyed · Nielsen 2024
View chart data
| Measure | Value |
|---|---|
| Very/extremely confident in ROI measurement | 84% |
| Measure traditional + digital together | 38% |
Start the review by asking what each number means. Is “revenue” a retailer shipment, an end-customer purchase, a signed order or a recognized accounting result? Is “pipeline” the full value of an opportunity or a probability-weighted estimate? A common label can hide very different measures.
Build a measurement chain
Connect activity to a relevant response, then to a qualified buying situation and a commercial outcome. For an industrial campaign, that might mean an accepted technical discussion progressing to a documented opportunity. For a consumer campaign, it may mean product consideration followed by verified sell-through.
Keep the stages distinct. A lead is not revenue, and an opportunity value is not profit. Record why an item progressed and use consistent account or opportunity identifiers across sales and partner reporting. This makes it easier to see when several activities contributed to the same result.
Distinguish attribution from incrementality
Attribution allocates credit among recorded touchpoints. It can be useful for describing a journey, but it does not by itself establish what would have happened without the campaign. Google’s Conversion Lift documentation describes controlled comparisons between treatment and control groups to estimate incremental conversions. [2]
Where a suitable experiment is available, define the outcome and test conditions before launch. Account for eligibility, measurement volume and possible contamination between groups. Where a credible test is not feasible, present the evidence as observational and describe the uncertainties rather than attaching causal language to an attribution report.
Use commercial return with a complete cost view
For a planning discussion, a useful expression is incremental contribution after relevant variable costs, minus marketing cost, divided by marketing cost. The organization should agree the exact definition with finance. Return on advertising spend, which relates revenue to advertising spend, answers a different question and should be labeled separately.
For projects that have not closed, report pipeline progression as a leading indicator instead of converting it into realized ROI. For consumer campaigns, consider returns, promotional funding and fulfillment effects when they materially change contribution. The aim is comparability, not a formula that makes every initiative appear successful.
Make the dashboard support a decision
Give each metric a purpose. Reach can diagnose distribution of the message. Qualified responses can test relevance. Stage progression can reveal commercial readiness. Incremental contribution, where measurable, can support investment choices. No single metric has to do all those jobs.
End the review with a specific decision: continue, change the audience, improve the offer, fix the handoff or stop an unproductive activity. A useful measurement system reduces uncertainty enough to make that decision better. It does not hide the remaining uncertainty behind a more elaborate dashboard.
Sources & data notes
Sources checked on 12 September 2026. Observation periods and forecast dates are stated alongside the figures. Recommendations are analysis, not measured outcomes from these studies.
- Nielsen — 2024 Annual Marketing Report release (25 April 2024) ↗
Global marketer survey; confidence and cross-channel measurement are different questions, not directly opposite categories.
- Google Ads Help — About Conversion Lift ↗
Controlled-experiment methodology. Product availability and eligibility vary; accessed 12 September 2026.
Banner: AI-generated conceptual illustration, not a photograph of a named project. Chart: created from the cited data; any rounding or derived index is identified above.

About the perspective
Marketing analytics, retail programmes and longer-cycle regional customer campaigns make consistent definitions essential across different commercial models.
These articles are personal industry analysis and do not represent an employer’s position or disclose customer project information.
Explore Khaled’s experience ↗