
The challenge
Forty-three spreadsheets and nine definitions of a qualified opportunity left regional teams debating the data instead of deciding where to invest. Marketing, sales and finance were measuring different parts of the same customer journey.
The approach
The work began with interviews across sales, marketing, finance and regional leadership to map reporting ownership and failure points. Shared definitions for campaigns, customer segments and opportunity stages created the foundation for consistent decisions.
Automated validation flagged missing information and duplicate records. Power BI dashboards brought pipeline, conversion, opportunity aging and channel contribution into one view.
Regional scorecards, common review templates and clear accountability turned the reporting framework into a monthly operating discipline. Adoption was built through collaboration with the teams who would use it.
- 01Align definitions
- 02Validate records
- 03Visualize pipeline
- 04Review decisions
The outcome
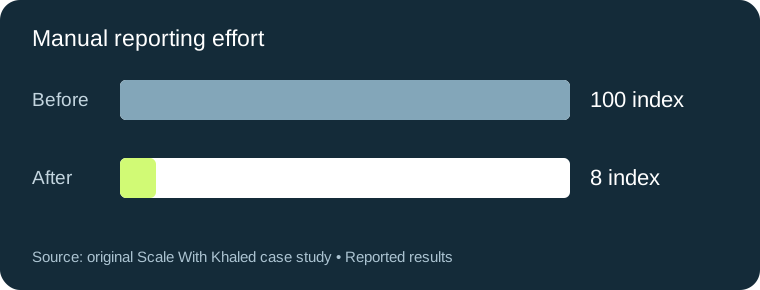
The original case study reports a 92% reduction in manual reporting effort, visibility across 16 markets and 95% regional adoption within 60 days. Executive preparation fell from five days to under four hours. These are portfolio-reported outcomes; the underlying measurement methodology is not published.

14 Weeks
Salesforce, Microsoft Power BI, Microsoft Excel, Microsoft Power Automate, Microsoft Teams, Miro
Source & measurement notes
Rewritten from the original Scale With Khaled project ↗. Figures are reported in that portfolio and have not been independently audited. Comparison periods and measurement limits are preserved where provided.
Banner: AI-generated conceptual artwork. Any original portfolio imagery shown below remains attributed to its source.